Four Ways to Turn Data into Better Decisions
Data has become an important resource for organizations across almost every industry. Businesses collect information about customers, sales, products, employees, marketing campaigns, financial transactions, and operational activities. However, collecting information is only the beginning. The real challenge is understanding what the information reveals and determining how it can support better decisions.
Imagine an e-commerce company that experiences a sudden decline in sales. The management team wants to understand what happened, identify the reasons behind the decline, estimate whether the situation will continue, and determine what actions could improve performance. Answering these questions requires different levels of analytical thinking.
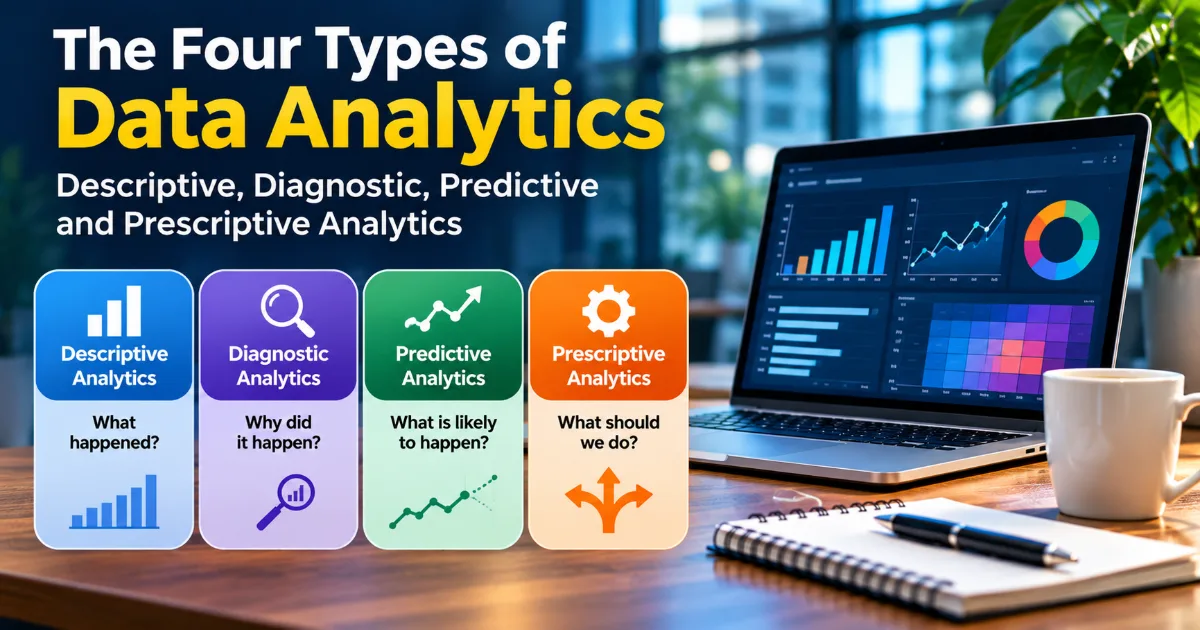
This is where the four major types of Data Analytics become important: Descriptive Analytics, Diagnostic Analytics, Predictive Analytics, and Prescriptive Analytics.
Each type addresses a different question. Descriptive Analytics explains what happened. Diagnostic Analytics investigates why it happened. Predictive Analytics estimates what is likely to happen next. Prescriptive Analytics evaluates what actions should be considered.
Continue Reading
These four approaches are closely connected and often work together within a single analytical project. Organizations may begin with historical reporting, investigate important patterns, develop forecasts, and finally use those forecasts to evaluate possible decisions.
Understanding these four types is essential for students, aspiring data analysts, business professionals, managers, and anyone interested in Data Science and Analytics. They provide a practical framework for understanding how information moves from basic reporting to advanced decision support.
1. What Are the Four Types of Data Analytics?
The four types of Data Analytics represent different approaches to examining information and supporting decisions.
Descriptive Analytics focuses on summarizing historical information. It helps organizations understand previous performance through reports, dashboards, charts, and statistical summaries.
Diagnostic Analytics investigates the reasons behind particular outcomes. It examines relationships, differences, and contributing factors to understand why something happened.
Predictive Analytics uses historical information, statistical techniques, and machine learning models to estimate future outcomes. It helps organizations prepare for possible future conditions.
Prescriptive Analytics evaluates possible actions and identifies decisions that may produce desirable outcomes. It can use optimization, simulation, predictive models, and business constraints to support decision-making.
Consider a supermarket chain that wants to improve its sales performance. Descriptive Analytics may reveal that sales declined by 10 percent during a particular month. Diagnostic Analytics may identify that product shortages and lower customer traffic contributed to the decline. Predictive Analytics may estimate future demand for different product categories. Prescriptive Analytics may recommend inventory adjustments, promotional strategies, or resource allocation changes.
The four approaches are not competing alternatives. They provide different perspectives on the same business problem.
2. Descriptive Analytics: Understanding What Happened
Descriptive Analytics is the process of examining historical data to summarize and explain past events or performance. It is generally the starting point of the analytical process because organizations need to understand what has already happened before investigating causes or making predictions.
Descriptive Analytics converts large datasets into understandable summaries using calculations, reports, dashboards, charts, and performance indicators.
For example, a retail company may collect thousands of sales transactions every day. Examining each transaction individually would make it difficult for management to understand overall performance. Instead, descriptive analysis can summarize the information into monthly revenue, total orders, average transaction value, best-selling products, and regional sales.
The resulting report provides a clear picture of the company's historical performance.
How Descriptive Analytics Works
The process generally begins with collecting historical information from relevant systems. Analysts then clean and organize the data, identify the measurements that matter, and calculate summary statistics.
The results may be presented through spreadsheets, business intelligence dashboards, monthly reports, and performance charts.
Common descriptive measurements include total, average, median, minimum, maximum, percentage change, frequency, and distribution.
For example, an organization may calculate the average monthly revenue over the previous twelve months. It may also compare the current month with the previous month and the same month in the previous year.
These comparisons help identify changes in business performance.
Common Techniques Used in Descriptive Analytics
Data aggregation is one of the most frequently used techniques. It combines individual records into meaningful summaries, such as total revenue by month or number of customers by region.
Frequency distribution shows how often different values or categories occur. A company may examine how many orders fall into different price ranges.
Trend analysis examines changes over time. It helps organizations understand whether revenue, website traffic, customer registrations, or operating costs are increasing or decreasing.
Data visualization presents information through charts and dashboards. Bar charts, line graphs, pie charts, and tables help stakeholders understand important measurements.
Segmentation divides information into groups. For example, customers can be grouped according to location, purchasing behaviour, subscription category, or product preference.
Real-World Example: Monthly Sales Reporting
Imagine an electronics retailer operating in five cities. At the end of each month, the company prepares a sales performance report.
The report contains total revenue, number of transactions, product category performance, average order value, and city-wise sales.
The management team discovers that Bengaluru generated the highest revenue, while another location experienced a decline compared with the previous month. Smartphones contributed the largest share of revenue, while accessories generated a smaller proportion.
These findings help the company understand its historical performance and identify areas that deserve further investigation.
However, the report does not automatically explain why the second location experienced declining sales. It simply describes what happened. The next stage is Diagnostic Analytics.
Tools Used in Descriptive Analytics
Microsoft Excel is commonly used for summary calculations, pivot tables, charts, and basic reporting. SQL helps retrieve and aggregate information from databases. Power BI and Tableau support interactive dashboards and business reports. Python libraries such as Pandas and Matplotlib can also be used to summarize and visualize datasets.
Advantages of Descriptive Analytics
Descriptive Analytics helps organizations monitor performance, establish baselines, identify trends, and communicate business results.
It provides a foundation for more advanced analysis because managers can use historical measurements to identify questions requiring further investigation.
Limitations of Descriptive Analytics
Descriptive Analytics mainly focuses on past events. It does not automatically establish why an outcome occurred or what will happen next.
For example, a report showing declining revenue cannot independently determine whether the reason was increased competition, lower demand, product shortages, pricing changes, or reduced marketing activity.
It provides the starting point for investigation rather than a complete explanation.
3. Diagnostic Analytics: Understanding Why Something Happened
Diagnostic Analytics examines historical information to investigate the reasons behind a particular outcome. It moves beyond summarizing performance and focuses on identifying possible contributing factors.
Organizations often use Diagnostic Analytics when they notice an unexpected change, operational problem, or difference in performance.
For example, a company may discover that customer complaints increased during a particular quarter. Descriptive Analytics identifies the increase, while Diagnostic Analytics investigates what may have contributed to it.
The investigation may examine delivery delays, product defects, customer service response times, changes in pricing, and differences between customer segments.
How Diagnostic Analytics Works
Diagnostic analysis generally begins with an observation or question.
Analysts identify the outcome that needs investigation and collect additional information that may help explain it.
They compare different periods, locations, customer groups, products, or operational processes. They may examine relationships between variables, investigate unusual observations, and use statistical methods to test possible explanations.
The objective is to develop evidence-supported explanations rather than simply guess at the reasons behind an outcome.
Common Techniques Used in Diagnostic Analytics
Drill-down analysis allows analysts to move from summarized information into more detailed records.
For example, a dashboard may show that overall revenue declined. The analyst can investigate revenue by region, product category, customer segment, and individual product.
Variance analysis compares actual performance with expected or planned performance. It is commonly used in financial reporting and operational management.
Correlation analysis examines relationships between variables. An organization may investigate whether customer satisfaction scores tend to decline when delivery times increase.
Root cause analysis attempts to identify the underlying factors contributing to a problem. Techniques such as the Five Whys and fishbone diagrams can help organize the investigation.
Comparative analysis examines differences between groups or time periods. For example, a business may compare customer retention rates before and after introducing a new subscription plan.
Statistical testing can help determine whether observed differences are consistent with a meaningful effect or could reasonably be explained by random variation.
Real-World Example: Investigating Declining E-Commerce Sales
Consider an online retailer that reports a 15 percent decline in monthly sales.
The descriptive report identifies the decline, but management wants to understand the reasons.
The analytics team examines website traffic and discovers that the number of visitors has remained relatively stable. However, the percentage of visitors completing a purchase has decreased.
The team then investigates the checkout process. It discovers that mobile users experience a higher payment failure rate than desktop users.
Further investigation reveals that a recent payment integration update introduced compatibility issues with certain mobile browsers.
This provides a potential explanation for the decline. The organization can now work with its technical team to investigate and resolve the payment problem.
This example demonstrates how Diagnostic Analytics can turn a general performance observation into a more specific investigation.
Tools Used in Diagnostic Analytics
SQL is useful for filtering, joining, and comparing records. Excel supports variance analysis and detailed comparisons. Python provides statistical and exploratory analysis capabilities through libraries such as Pandas, SciPy, and Statsmodels.
Power BI and Tableau allow users to drill down into dashboards and explore different dimensions of business performance.
Advantages of Diagnostic Analytics
Diagnostic Analytics helps organizations investigate problems, understand performance differences, and identify possible contributing factors.
It can improve operational troubleshooting, customer experience analysis, financial investigations, and quality management.
Limitations of Diagnostic Analytics
Identifying a relationship does not necessarily establish causation.
For example, an organization may discover that advertising expenditure and sales revenue increased during the same period. This does not automatically prove that advertising caused the entire increase. Seasonal demand, pricing changes, competitor activity, and other factors may also influence sales.
Diagnostic Analytics therefore requires careful interpretation, suitable evidence, and an understanding of the business environment.
4. Predictive Analytics: Understanding What Is Likely to Happen
Predictive Analytics uses historical information, statistical modelling, and machine learning techniques to estimate future outcomes.
Unlike descriptive and diagnostic approaches, which primarily investigate past events, predictive analytics focuses on possible future conditions.
Organizations use it to forecast demand, estimate customer behaviour, evaluate risks, predict equipment failures, and plan resources.
For example, a telecommunications company may analyze historical customer behaviour to estimate which subscribers are likely to discontinue their services. The company can use these predictions to identify customers who may benefit from improved support or suitable retention offers.
Predictive Analytics does not provide certainty. It estimates possible outcomes based on available information and the assumptions used in the model.
How Predictive Analytics Works
The process begins with identifying the outcome that needs to be estimated.
Analysts collect relevant historical information and prepare it for modelling. They then identify useful variables, select an appropriate statistical or machine learning method, and train a model using historical observations.
The model is evaluated using information that was not used during training. This helps determine whether it can generalize to new observations.
Once the model demonstrates suitable performance, it may be integrated into an operational system or analytical workflow.
Predictions should be monitored because relationships in historical data may change over time.
Common Techniques Used in Predictive Analytics
Regression analysis is used to estimate numerical outcomes. For example, a company may predict monthly revenue based on historical sales, pricing, seasonal factors, and marketing activity.
Classification models estimate the category to which an observation belongs. A bank may use classification techniques to identify transactions that require additional fraud investigation.
Time-series forecasting examines information collected over time to estimate future values. It is commonly used for sales forecasting, inventory planning, and demand estimation.
Decision trees divide information into smaller groups according to selected conditions. They can support classification and regression tasks.
Random forests combine multiple decision trees to improve prediction performance in many applications.
Gradient boosting methods build predictive models through a sequence of learning steps and are commonly used for structured datasets.
Neural networks can identify complex patterns in certain types of information and are particularly important in deep learning applications.
Real-World Example: Customer Churn Prediction
A subscription-based business wants to reduce the number of customers cancelling their subscriptions.
The company collects historical information about subscription duration, service usage, payment history, customer support interactions, plan changes, and previous cancellations.
Analysts use this information to develop a predictive model that estimates the likelihood of future cancellation.
The model may identify patterns suggesting that customers with declining usage, repeated service complaints, and unresolved payment problems have a higher likelihood of leaving.
The customer retention team can use these insights to investigate individual cases and consider appropriate interventions.
The prediction does not guarantee that a particular customer will cancel. It helps the organization prioritize attention and evaluate possible retention strategies.
Tools Used in Predictive Analytics
Python is widely used for predictive modelling through libraries such as Scikit-learn, Statsmodels, TensorFlow, and PyTorch.
R provides statistical modelling capabilities. SQL helps prepare training datasets. Cloud platforms support large-scale data processing and model deployment.
Advantages of Predictive Analytics
Predictive Analytics helps organizations prepare for future conditions, estimate risks, improve planning, and identify opportunities.
It can support inventory management, customer retention, financial forecasting, maintenance planning, and demand estimation.
Limitations of Predictive Analytics
Predictions depend on the quality and relevance of historical information.
If customer behaviour, market conditions, or operating processes change significantly, a model may become less accurate.
Models can also inherit biases from historical data or produce misleading results when their assumptions are not properly evaluated.
Organizations should monitor model performance, document limitations, and maintain appropriate human oversight.
5. Prescriptive Analytics: Understanding What Action Should Be Taken
Prescriptive Analytics is the most decision-oriented of the four major types. It uses analytical findings, predictions, optimization methods, simulations, and business constraints to evaluate possible actions.
Predictive Analytics may estimate that demand for a product will increase next month. Prescriptive Analytics goes further by examining how much inventory should be ordered, when it should be delivered, and how resources should be allocated.
The objective is to help organizations choose actions that align with their goals while considering practical limitations.
How Prescriptive Analytics Works
Prescriptive analysis generally begins with a defined objective.
An organization may want to maximize profit, reduce transportation costs, minimize delivery delays, improve production efficiency, or allocate resources more effectively.
Analysts identify available decision variables, constraints, and relevant information.
Optimization techniques can then be used to evaluate possible solutions. Simulation may help organizations understand how different scenarios could affect outcomes.
The recommendations are evaluated against business priorities, operational requirements, and real-world constraints.
Common Techniques Used in Prescriptive Analytics
Linear programming helps optimize objectives subject to mathematical constraints. It can be used to allocate resources, plan production, or distribute budgets.
Integer programming is useful when decisions involve whole numbers, such as the number of vehicles or employees assigned to a particular task.
Simulation allows organizations to model possible scenarios and understand how different decisions may affect outcomes.
Optimization algorithms help identify solutions that satisfy defined objectives and constraints.
Decision analysis evaluates alternative actions under different conditions and levels of uncertainty.
Rule-based systems can combine business policies and analytical information to guide operational decisions.
Real-World Example: Optimizing Delivery Routes
A logistics company receives thousands of delivery requests every day.
Predictive Analytics may estimate the expected delivery demand for different locations. However, the company still needs to determine how vehicles should be assigned and which routes should be followed.
Prescriptive Analytics can consider delivery locations, vehicle capacity, driver availability, traffic conditions, delivery deadlines, fuel costs, and operating constraints.
An optimization model can evaluate possible route combinations and recommend an efficient delivery plan.
The company can then compare the recommendations with actual operating conditions before implementing them.
This approach may help reduce unnecessary travel, improve delivery planning, and use available resources more effectively.
Tools Used in Prescriptive Analytics
Python offers optimization libraries such as SciPy and OR-Tools. Specialized optimization environments and commercial solvers can support more complex mathematical models.
Spreadsheet Solver can help beginners understand basic optimization problems. Simulation tools and business planning platforms are also used in specialized applications.
Advantages of Prescriptive Analytics
Prescriptive Analytics helps organizations evaluate alternative decisions, allocate resources, manage constraints, and improve operational planning.
It is particularly useful when decisions involve several competing objectives and limited resources.
Limitations of Prescriptive Analytics
Recommendations are only as reliable as the information, assumptions, and constraints used in the analysis.
An optimization model may produce a mathematically attractive solution that is difficult to implement because it does not fully account for employee availability, customer expectations, regulations, or unexpected disruptions.
Human judgment remains important, especially when decisions affect customers, employees, finances, or public services.
6. Comparing the Four Types of Data Analytics
Although the four approaches are connected, each has a distinct objective.
Descriptive Analytics answers the question, "What happened?" It focuses on historical reporting and performance summaries.
Diagnostic Analytics answers, "Why did it happen?" It investigates contributing factors and relationships.
Predictive Analytics answers, "What is likely to happen?" It estimates possible future outcomes.
Prescriptive Analytics answers, "What should we do?" It evaluates actions and recommends potential decisions.
Consider a bank examining its loan portfolio.
Descriptive Analytics may reveal that loan defaults increased during the previous quarter.
Diagnostic Analytics may investigate whether the increase is associated with changes in customer segments, repayment history, economic conditions, or lending policies.
Predictive Analytics may estimate the probability of future defaults for different loan categories.
Prescriptive Analytics may evaluate possible changes to risk management processes, repayment support, lending criteria, or resource allocation.
The four approaches work together to provide a more complete understanding of the situation.
7. A Complete Business Case Study: Applying All Four Types of Analytics
To understand how these approaches work together, consider a fictional online retail company called ShopSphere.
ShopSphere sells electronics, home appliances, clothing, and accessories through its website and mobile application. During a quarterly management review, the leadership team notices that revenue has declined despite a relatively stable number of website visitors.
The company decides to investigate the problem using all four types of Data Analytics.
Stage One: Descriptive Analytics Identifies the Problem
The analytics team collects historical information about sales, orders, website traffic, product categories, customer segments, and payment transactions.
The team prepares a dashboard containing monthly revenue, order volume, average order value, conversion rate, and regional performance.
The dashboard reveals that revenue declined by 12 percent over the quarter. Website traffic remained relatively stable, but the purchase conversion rate decreased.
The report also shows that mobile users account for most website visitors and that the decline is particularly noticeable in two product categories.
At this stage, the company understands what happened but does not yet know why.
Stage Two: Diagnostic Analytics Investigates the Reasons
The team examines checkout activity, payment failures, delivery charges, product availability, and customer complaints.
The investigation reveals that mobile checkout failures increased after a recent application update. The team also identifies a rise in abandoned carts among customers who encounter unexpected delivery charges.
The company now has evidence of several possible contributing factors.
Further testing helps establish whether the application update is responsible for the payment failures. The technical team identifies a compatibility problem affecting certain devices.
Stage Three: Predictive Analytics Estimates Future Outcomes
After identifying the problems, the company examines historical information to estimate how different customer and operational patterns may affect future sales.
A forecasting model estimates expected demand by product category and region.
A customer behaviour model estimates which customers are more likely to abandon purchases under certain conditions.
These predictions help the company understand where additional attention may be required.
The forecasts are treated as estimates rather than guaranteed outcomes, and the team monitors their accuracy against actual results.
Stage Four: Prescriptive Analytics Evaluates Possible Actions
The company considers several possible actions.
The technical team proposes correcting the mobile checkout problem. The marketing team evaluates whether delivery offers could reduce cart abandonment. The inventory team examines whether stock availability should be adjusted for products experiencing stronger demand.
Optimization techniques help evaluate how inventory and marketing budgets could be allocated within the available financial constraints.
Management reviews the recommendations and selects actions that are operationally feasible.
Measuring the Results
After implementation, the company monitors conversion rates, payment success, average order value, customer complaints, and revenue.
The results are compared with the original performance measurements to understand whether the changes produced the intended improvements.
This example demonstrates that the four types of Data Analytics are most valuable when they operate as connected stages of an evidence-based decision-making process.
8. Which Type of Data Analytics Should You Use?
The correct analytical approach depends on the question being investigated.
If an organization wants to understand historical performance, Descriptive Analytics is usually the appropriate starting point.
If it wants to investigate the reasons behind a particular outcome, Diagnostic Analytics becomes more useful.
If it needs to estimate future demand, risks, or customer behaviour, Predictive Analytics may be appropriate.
If it needs to compare possible actions and determine how resources should be allocated, Prescriptive Analytics can provide additional decision support.
In many situations, organizations need more than one type.
For example, a marketing department may first summarize campaign results, investigate why one campaign performed better than another, forecast future campaign outcomes, and evaluate how its budget should be distributed.
The important point is to select the analytical method according to the business objective rather than using advanced techniques unnecessarily.
A simple descriptive report may be sufficient for a straightforward performance question. Building a machine learning model or optimization system for the same question could introduce unnecessary complexity.
9. Skills Required to Work with the Four Types of Data Analytics
A professional working in Data Analytics needs a combination of technical, statistical, analytical, and communication skills.
Statistical Knowledge
Understanding averages, distributions, variability, correlation, probability, sampling, and hypothesis testing is important for interpreting information correctly.
Predictive and diagnostic projects often require additional statistical knowledge.
SQL and Database Skills
SQL is essential for retrieving information from databases and preparing datasets for analysis.
Professionals should understand filtering, joins, aggregations, subqueries, and window functions.
Spreadsheet Skills
Excel is useful for basic analysis, calculations, data preparation, and reporting.
Pivot tables, lookup functions, conditional formatting, and charts are particularly valuable.
Python and R
Python supports data preparation, automation, visualization, statistical analysis, and machine learning.
R is useful for statistical computing and research-oriented analytical work.
Data Visualization
Professionals should understand how to select suitable charts, build dashboards, and communicate findings clearly.
Power BI and Tableau are widely used in business reporting environments.
Machine Learning Fundamentals
Predictive Analytics requires an understanding of training data, testing data, model evaluation, classification, regression, and common modelling limitations.
Optimization and Decision-Making
Prescriptive Analytics may require knowledge of linear programming, constraints, objective functions, simulation, and decision analysis.
Business Understanding and Communication
Technical skills alone are not sufficient. Analysts must understand the problem being solved and communicate their conclusions to people who may not have technical backgrounds.
10. Common Mistakes to Avoid When Using Data Analytics
One common mistake is confusing correlation with causation. Two variables may be related without one directly causing the other. Additional investigation is necessary before making causal claims.
Another mistake is ignoring data quality. Missing records, duplicate transactions, incorrect categories, and inconsistent formats can produce misleading results.
Using the wrong analytical method is also a frequent problem. A forecasting model cannot automatically explain why an event happened, and a historical dashboard cannot guarantee what will happen next.
Organizations may also focus too heavily on technical complexity. An advanced model is not necessarily better if a simpler method answers the business question more accurately and transparently.
Another challenge is presenting findings without explaining their limitations. Every analytical result depends on data, assumptions, and methodology. Stakeholders should understand these limitations before making important decisions.
Finally, analytical projects should not end with the production of a report. Findings need to be connected to decisions, and the outcomes of those decisions should be monitored.
11. The Role of Artificial Intelligence in the Four Types of Analytics
Artificial Intelligence is expanding the capabilities of Data Analytics by making it easier to process large datasets, recognize patterns, automate repetitive tasks, and develop predictive models.
In Descriptive Analytics, AI-assisted tools can help summarize reports, generate visualizations, and identify unusual changes in performance.
In Diagnostic Analytics, machine learning and advanced analytical methods can help examine complex relationships and identify patterns that deserve further investigation.
In Predictive Analytics, machine learning algorithms can estimate customer behaviour, demand, equipment failures, and other future outcomes.
In Prescriptive Analytics, AI and optimization techniques can help evaluate alternatives, simulate scenarios, and recommend possible decisions.
However, AI does not eliminate the need for reliable information or human judgment. Automated systems may produce incorrect explanations, inherit bias, or fail when conditions change.
Professionals must validate outputs, understand model limitations, and ensure that recommendations are appropriate for the intended application.
The future of analytics will increasingly involve collaboration between human expertise, statistical methods, business intelligence tools, and AI-powered systems.
12. How Beginners Can Practise the Four Types of Data Analytics
The best way to understand these concepts is to apply them to a single dataset and investigate different questions.
A beginner can start with a publicly available retail sales dataset containing transaction dates, product names, quantities, prices, customer categories, and locations.
For Descriptive Analytics, calculate total revenue, monthly sales, average order value, and product category performance. Create charts that summarize the findings.
For Diagnostic Analytics, investigate why sales increased or decreased during particular months. Compare regions, product categories, customer segments, and transaction values. Explore possible contributing factors without assuming that a correlation proves causation.
For Predictive Analytics, use historical observations to estimate future monthly sales. Start with a simple forecasting approach and compare predictions with actual values using suitable evaluation metrics.
For Prescriptive Analytics, create a basic inventory allocation problem. Assume that different products have different expected demand, costs, and storage requirements. Explore how inventory could be distributed within a limited budget.
Use Excel for the initial calculations, SQL for retrieving and grouping information, and Python for more advanced analysis.
Document the questions, methods, assumptions, results, and limitations. This creates a meaningful portfolio project that demonstrates understanding of the complete analytical process.
Conclusion: From Understanding the Past to Making Better Future Decisions
The four types of Data Analytics provide a structured way to transform information into meaningful business knowledge.
Descriptive Analytics helps organizations understand historical performance. Diagnostic Analytics investigates why particular outcomes occurred. Predictive Analytics estimates what may happen in the future. Prescriptive Analytics evaluates possible actions and helps organizations make informed decisions.
Each approach serves a different purpose, but their combined use creates a more complete analytical process.
For students and beginners, understanding these four categories provides an important foundation for learning Data Analytics, Business Intelligence, Statistics, and Data Science. Practical experience with Excel, SQL, Python, Power BI, Tableau, statistics, and machine learning can help turn theoretical knowledge into professional skills.
For organizations, the ability to move from reporting to investigation, forecasting, and decision support can improve planning and operational performance.
The most important lesson is that analytics is not simply about producing charts, reports, or predictions. It is about asking meaningful questions, examining evidence, understanding uncertainty, and selecting actions that support real objectives.
When organizations learn to connect these four types of analytics, data becomes more than a collection of historical records. It becomes a valuable resource for understanding challenges, identifying opportunities, and making better decisions.
#DataAnalytics #DescriptiveAnalytics #PredictiveAnalytics #BusinessIntelligence #DataScience