
We live in a world where almost every activity generates data. When someone searches for information online, purchases a product, watches a video, makes a digital payment, books a flight, uses a mobile application, or interacts with a business, information is created and recorded.
Organizations collect enormous amounts of this information every day. However, collecting data alone does not create value. The real value comes from understanding what the data represents, identifying patterns, discovering relationships, and using those findings to make better decisions.
This is where Data Science becomes important. Data Science is a multidisciplinary field that combines statistics, mathematics, programming, analytical thinking, and domain knowledge to extract meaningful information from structured and unstructured data. It helps organizations understand what has happened, why something happened, what might happen next, and what actions could produce better outcomes.
Today, Data Science influences almost every major industry. Banks use it to identify suspicious transactions and evaluate financial risks. Hospitals use it to support medical research and improve healthcare operations. Retail companies analyze purchasing patterns to understand customer preferences. Transportation platforms use predictive models to estimate demand and improve route planning. Educational institutions examine student performance to identify learning difficulties and improve teaching methods.
The importance of Data Science is not limited to large technology companies. Small businesses, startups, government departments, educational institutions, and independent professionals can also benefit from data-driven approaches. As digital systems become more widespread, the ability to understand and work with data is becoming an increasingly valuable professional skill.
Continue Reading
This article introduces the fundamentals of Data Science, explains how it works, explores its major components, discusses its practical applications, and provides a learning roadmap for people who want to enter this field.
1. What Is Data Science?
Data Science is the process of extracting useful knowledge, insights, and predictions from data using scientific methods, statistical techniques, programming, and analytical tools. It involves collecting information, preparing it for analysis, exploring patterns, building models, interpreting results, and communicating findings.
The central objective of Data Science is to transform raw information into something useful. Raw data may contain thousands or millions of records, but without analysis, it can be difficult to understand. Data scientists use different techniques to organize this information, identify meaningful relationships, and develop solutions to specific problems.
Consider an online shopping company that receives thousands of orders every day. The company has information about products, prices, customers, delivery locations, payment methods, purchase dates, and customer feedback. Looking at individual orders may not reveal much about the overall business. However, analyzing the complete dataset could reveal that certain products sell more during particular months, customers in specific locations prefer particular categories, and delivery delays are associated with higher cancellation rates.
These findings can help the company improve inventory planning, personalize recommendations, optimize delivery operations, and increase customer satisfaction.
Data Science therefore goes beyond simply calculating numbers. It connects data with real-world questions and helps organizations understand what actions they should consider.
2. Understanding the Difference Between Data Science, Data Analytics, and Data Analysis
Data Science, Data Analytics, and Data Analysis are closely connected terms, but they do not represent exactly the same activities. Understanding their differences is important for anyone beginning a career in this domain.
Data Analysis focuses on examining available information to answer specific questions. Analysts clean, organize, summarize, and interpret data to understand business performance or investigate a particular situation. For example, a sales analyst might compare monthly revenue to determine which products performed best.
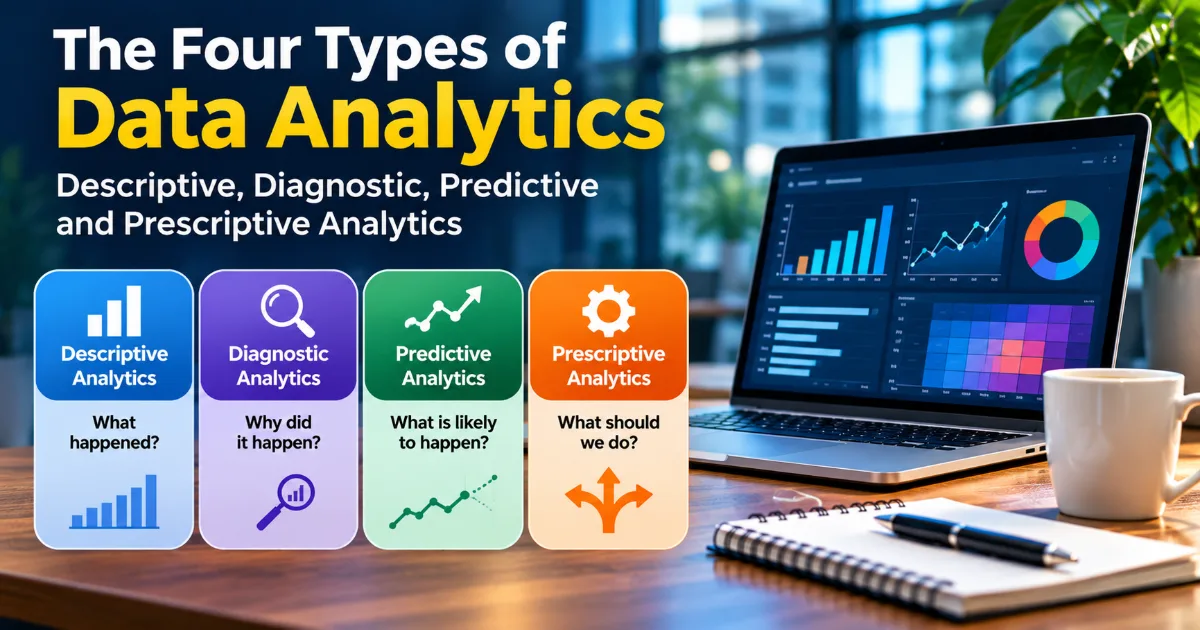
Data Analytics is a broader practice of using data, analytical methods, and technologies to support decisions. It includes descriptive, diagnostic, predictive, and prescriptive analytics. A data analytics professional may investigate business performance, identify the reasons behind changes, forecast future outcomes, and recommend possible actions.
Data Science covers a broader combination of statistical analysis, programming, experimentation, machine learning, and predictive modelling. Data scientists may develop algorithms that learn from historical information and generate predictions or automate certain decisions.
For example, consider an online retail company trying to understand customer purchasing behaviour.
A data analyst may examine historical transactions and identify which products generate the highest revenue. A data analytics professional may investigate why sales declined in a particular region and forecast future demand. A data scientist may develop a machine learning model that predicts which customers are likely to purchase a particular product.
These roles overlap considerably in real organizations. Their responsibilities depend on company size, business requirements, team structure, and individual experience. However, the distinction provides a useful starting point for understanding the different career paths available.
3. Why Is Data Science Important?
Data Science is important because modern organizations operate in increasingly complex environments. They must understand customers, manage resources, respond to competition, identify risks, and make decisions quickly. Traditional decision-making based entirely on assumptions or limited observations may not be sufficient.
One of the major advantages of Data Science is that it supports evidence-based decision-making. Instead of relying only on intuition, organizations can examine actual performance, customer behaviour, market conditions, and operational information before selecting a strategy.
Another important benefit is the ability to identify patterns that may not be visible through ordinary observation. A company may discover that customers who purchase one category of products frequently purchase another category within the following month. A bank may identify unusual transaction patterns associated with potential fraud. A hospital may recognize operational factors that contribute to longer patient waiting times.
Data Science also supports automation. Once a reliable model has been developed and deployed, it can process large volumes of information and generate predictions without requiring every record to be examined manually.
Its importance can be understood through several major benefits.
Better Decision-Making
Organizations can use data to evaluate alternatives, understand performance, and measure the results of their decisions. For example, a marketing team can compare campaign performance across different customer segments and allocate its budget according to measurable outcomes.
Understanding Customer Behaviour
Businesses can analyze purchasing history, website interactions, customer feedback, and engagement patterns to understand what customers need. These insights can improve product development, customer support, and personalized recommendations.
Improved Operational Efficiency
Data analysis can reveal delays, unnecessary expenses, resource shortages, and inefficient processes. Manufacturing companies can examine equipment performance to plan maintenance, while logistics businesses can analyze delivery information to improve route planning.
Risk Identification and Management
Financial institutions, insurance companies, and cybersecurity teams use analytical techniques to identify unusual activities, evaluate risks, and prioritize investigations. These systems can help professionals recognize warning signs earlier.
Innovation and Product Development
Companies can use customer feedback, market research, and usage patterns to identify opportunities for new products and services. Data can also help organizations test ideas before investing significant resources in development.
4. The Different Types of Data Used in Data Science
Understanding data types is one of the first steps in learning Data Science. Different forms of data require different preparation, storage, and analytical techniques.
Structured Data
Structured data is organized according to a predefined format, usually using rows and columns. It is commonly stored in relational databases and spreadsheets.
Examples include customer records, employee information, product inventories, transaction histories, and monthly sales reports.
A spreadsheet containing customer names, purchase dates, product categories, and transaction amounts is an example of structured data. Because the information follows a consistent format, it can be queried and analyzed using SQL, spreadsheets, Python, and other tools.
Unstructured Data
Unstructured data does not follow a fixed tabular structure. It may contain text, images, videos, audio recordings, or documents.
Examples include social media posts, customer reviews, photographs, recorded conversations, emails, and video content.
Analyzing unstructured data often requires specialized techniques. Natural Language Processing can help interpret text, while computer vision can be used to analyze images and videos.
Semi-Structured Data
Semi-structured data has some organizational properties but does not necessarily follow a traditional relational database structure.
JSON, XML, and certain log files are common examples. These formats contain identifiable fields, labels, or hierarchical relationships that make the information easier to process than completely unstructured data.
Quantitative and Qualitative Data
Data can also be classified according to its nature.
Quantitative data represents measurable quantities, such as age, salary, revenue, distance, temperature, and product sales. It can be analyzed using mathematical and statistical methods.
Qualitative data represents characteristics, categories, opinions, or descriptions. Examples include customer satisfaction comments, product categories, feedback, and interview responses.
Both types are important because numerical measurements often explain what is happening, while qualitative information can help explain the experiences and reasons behind those measurements.
5. How Does Data Science Work? Understanding the Data Science Lifecycle
Data Science is not a single activity. It follows a series of interconnected stages that transform a real-world problem into an analytical solution.
The exact process may vary depending on the project, but most Data Science workflows include the following stages.
Step 1: Problem Definition
Every successful Data Science project begins with a clearly defined problem. Before collecting information or writing code, professionals must understand what they are trying to solve.
For example, an online business may notice that many customers add products to their shopping carts but do not complete their purchases. The business wants to understand why this happens and identify ways to reduce cart abandonment.
The team must define the objective, identify the expected outcome, understand the available resources, and determine how success will be measured.
A poorly defined problem can lead to unnecessary analysis, unsuitable models, and misleading conclusions.
Step 2: Data Collection
Once the problem is defined, the next step is collecting relevant information.
Data may come from databases, application programming interfaces, business software, surveys, website analytics, sensors, public datasets, transaction systems, and other sources.
For the online shopping example, the company may collect information about product views, cart additions, checkout activity, payment failures, device types, delivery charges, and completed orders.
The quality and relevance of collected data directly affect the usefulness of the final analysis.
Step 3: Data Cleaning and Preparation
Real-world datasets are rarely perfect. They may contain missing values, duplicate records, inconsistent formats, incorrect entries, and irrelevant information.
Data cleaning involves identifying and correcting these problems. Professionals may remove duplicates, standardize date formats, investigate unusual values, handle missing information, and combine datasets from different sources.
For example, customer records may contain different spellings of the same city. Before comparing regional sales, the analyst must standardize these entries to prevent the same location from being counted as multiple categories.
Data preparation is often one of the most time-consuming parts of a Data Science project because unreliable input can produce unreliable results.
Step 4: Exploratory Data Analysis
Exploratory Data Analysis, commonly known as EDA, involves examining a dataset to understand its structure, distribution, relationships, and unusual patterns.
Professionals use summary statistics, frequency distributions, charts, correlation analysis, and other techniques to explore the information.
For example, an e-commerce company might discover that checkout abandonment is higher on mobile devices than on desktop computers. It may also find that customers facing unexpected delivery charges are more likely to leave before completing a purchase.
These findings help determine which questions should be investigated further.
Step 5: Statistical Analysis and Feature Engineering
Statistical analysis helps professionals understand relationships, differences, uncertainty, and patterns in data.
Feature engineering involves creating or transforming variables to make them more useful for analysis or machine learning.
For example, a company may have a transaction date but want to understand seasonal purchasing behaviour. An analyst can derive additional features such as month, weekday, quarter, or holiday period.
Similarly, a customer's total purchase value, average order size, and number of purchases over the previous 90 days may provide more useful information than individual transaction records alone.
Step 6: Model Development
When a project requires predictions or automated pattern recognition, professionals may develop statistical or machine learning models.
A model learns relationships from historical data and uses those relationships to estimate outcomes for new observations.
For example, a bank may train a model using historical loan information to estimate the probability that an applicant will fail to repay a loan. The model may consider factors such as income, existing debt, repayment history, and other relevant variables.
Model development involves selecting an appropriate algorithm, preparing training data, defining evaluation methods, and comparing alternative approaches.
Step 7: Model Evaluation
A model should never be considered successful simply because it produces predictions. Its performance must be evaluated using appropriate metrics and testing procedures.
For classification problems, common metrics include accuracy, precision, recall, and F1-score. For regression problems, professionals may use mean absolute error, mean squared error, and root mean squared error.
The choice of metric depends on the problem. In fraud detection, for example, identifying fraudulent transactions may be more important than achieving high overall accuracy.
Professionals should also examine whether a model performs consistently on unseen data and whether it introduces unfair or misleading outcomes.
Step 8: Deployment and Monitoring
A model becomes useful to an organization when its predictions can be incorporated into an actual workflow.
Deployment may involve integrating the model into a website, mobile application, business system, or internal decision-support platform.
However, deployment is not the end of the process. Data patterns can change over time, and a model that performs well today may become less reliable in the future.
Monitoring helps identify changes in input data, prediction quality, and business outcomes. Models may require maintenance, retraining, or replacement when conditions change.
6. Essential Technologies and Tools Used in Data Science
Data Science professionals use different tools depending on their responsibilities, project requirements, and technical environments. Beginners do not need to learn every tool immediately. It is more effective to understand the purpose of each technology and gradually develop practical experience.
Python
Python is one of the most widely used programming languages in Data Science because it has a readable syntax and a large ecosystem of analytical libraries.
NumPy supports numerical computing and array operations. Pandas provides tools for organizing, cleaning, and analyzing tabular data. Matplotlib and Seaborn help create visualizations. Scikit-learn provides machine learning algorithms and evaluation tools.
Python is useful for automating repetitive tasks, exploring datasets, building predictive models, and developing analytical applications.
SQL
Structured Query Language, commonly called SQL, is used to retrieve, manage, and analyze information stored in relational databases.
Data professionals use SQL to filter records, combine tables, calculate aggregates, group information, and prepare datasets for further analysis.
For example, a sales analyst may write a SQL query to calculate monthly revenue by product category or identify customers who have not made a purchase in the last six months.
SQL is an essential skill because many organizations store their business information in databases.
Microsoft Excel
Excel remains an important analytical tool, particularly for small and medium-sized datasets, financial calculations, reporting, and business analysis.
Its features include formulas, pivot tables, conditional formatting, charts, lookup functions, and data-cleaning capabilities.
Beginners can use Excel to understand basic analytical concepts before moving into more advanced programming environments.
Power BI and Tableau
Power BI and Tableau are business intelligence and data visualization platforms used to transform information into interactive reports and dashboards.
They help organizations monitor key performance indicators, compare business results, identify trends, and communicate findings to decision-makers.
For example, a sales dashboard may display monthly revenue, regional performance, customer acquisition, product categories, and target achievement.
R Programming
R is a programming language designed for statistical computing, data analysis, and visualization. It is widely used in academic research, statistical modelling, and certain specialized analytical environments.
Its ecosystem includes packages for data manipulation, statistical testing, visualization, and reporting.
Machine Learning Libraries
Scikit-learn, TensorFlow, and PyTorch support different types of machine learning and deep learning applications.
Scikit-learn is especially useful for traditional machine learning tasks, while TensorFlow and PyTorch support more advanced neural network development and deep learning research.
Learning these libraries becomes more valuable after developing a foundation in statistics, programming, and data preparation.
7. Real-World Applications of Data Science Across Industries
Data Science is valuable because its techniques can be applied to different types of problems. The following examples demonstrate how organizations use data to improve services and operations.
Healthcare
Healthcare organizations generate information through patient records, laboratory tests, medical imaging, hospital management systems, and research activities.
Data Science can help researchers examine disease patterns, study treatment outcomes, identify operational bottlenecks, and support clinical decision-making.
For example, hospitals can analyze historical appointment information to forecast patient demand and improve staff scheduling. Medical researchers can examine large datasets to identify relationships between health factors and disease outcomes.
These applications should support qualified medical professionals rather than replace clinical judgment.
Banking and Financial Services
Banks process large volumes of transactions and must identify suspicious activities, evaluate credit risk, and protect customer information.
Data Science helps financial institutions analyze transaction behaviour, detect unusual patterns, estimate risk, and understand customer needs.
Fraud detection models may identify transactions that differ significantly from a customer's usual activity. Credit risk models can help institutions evaluate applications using relevant financial information.
Human oversight, fairness, explainability, and regulatory compliance remain essential.
Retail and E-Commerce
Retail businesses use data to understand customer preferences, forecast demand, optimize inventory, and improve marketing performance.
Recommendation systems can suggest products based on browsing activity, previous purchases, and similarities between customers or products.
Demand forecasting helps retailers estimate how much inventory they may need during different periods.
For example, a clothing retailer may use historical sales information to understand seasonal demand and reduce the risk of overstocking or running out of popular products.
Education
Educational institutions can analyze attendance, assessment results, course engagement, and learning progress.
These insights can help teachers identify students who may need additional support and help institutions improve course design.
For example, an online learning platform may examine how learners interact with lessons and identify sections where many students stop progressing. The institution can then investigate whether the content, difficulty level, or learning experience needs improvement.
Transportation and Logistics
Transportation companies use Data Science to estimate demand, optimize routes, predict delivery times, and improve resource allocation.
A logistics company may combine historical delivery records, traffic information, weather conditions, and geographic data to improve delivery planning.
Ride-hailing platforms may use demand forecasting to estimate where passengers are likely to request vehicles during different times of the day.
Marketing and Advertising
Marketing teams use analytical techniques to evaluate campaigns, identify customer segments, and understand conversion behaviour.
They can compare the performance of different advertisements, examine customer engagement, and identify which channels contribute to business objectives.
For example, a company may discover that one campaign generates many website visits but relatively few purchases. This finding can encourage the marketing team to investigate landing-page quality, audience targeting, pricing, or the checkout experience.
Manufacturing
Manufacturing organizations use sensor data, production records, and equipment performance information to improve quality and operational efficiency.
Predictive maintenance systems can identify patterns associated with equipment failures and help schedule maintenance before serious disruptions occur.
Production analytics can also reveal bottlenecks, waste, and variations in product quality.
8. Understanding Statistics: The Foundation of Data Science
Statistics is one of the most important foundations of Data Science. It provides methods for collecting, summarizing, interpreting, and drawing conclusions from information.
Descriptive statistics help summarize datasets using measures such as mean, median, mode, range, variance, and standard deviation.
For example, if a company wants to understand its average order value, it can calculate the mean transaction amount. However, if a few extremely large transactions distort the average, the median may provide a more representative picture of a typical order.
Inferential statistics helps professionals draw conclusions about a larger population using information from a sample. It includes concepts such as confidence intervals, hypothesis testing, and statistical significance.
Probability provides a mathematical framework for understanding uncertainty. It is especially useful in predictive modelling, risk analysis, and machine learning.
Correlation measures the strength and direction of an association between variables. However, correlation does not automatically establish causation. Two variables may move together because of a third factor or because of coincidence.
Understanding these concepts helps data professionals avoid misleading interpretations and make more reliable conclusions.
9. Challenges and Limitations of Data Science
Although Data Science offers significant opportunities, it also involves challenges that organizations must understand.
Data quality is one of the biggest concerns. Incomplete, outdated, inconsistent, or inaccurate information can produce misleading findings. Even advanced algorithms cannot automatically correct every problem in the source data.
Data privacy is another important issue. Personal information must be collected, processed, stored, and shared responsibly. Organizations need appropriate security practices, access controls, consent mechanisms, and compliance with applicable laws.
Bias in data can also create unfair outcomes. If historical information reflects unequal treatment or incomplete representation, a model trained on that information may reproduce those patterns.
Interpretability is important when decisions affect people. Organizations should understand how a model reaches its conclusions, particularly in areas such as finance, healthcare, employment, and public services.
Another challenge is the difference between technical results and business value. A model may achieve impressive performance in a testing environment but provide little practical benefit if it does not address an important organizational problem.
Successful Data Science therefore requires technical knowledge, responsible practices, communication, and a clear understanding of the problem being solved.
10. Career Opportunities in Data Science and Analytics
Data Science offers several career paths for people with different interests and technical strengths. Some roles focus primarily on business analysis, while others involve programming, statistical modelling, machine learning, or data infrastructure.
A Data Analyst examines datasets, prepares reports, identifies trends, and communicates findings. This role is suitable for people interested in analytical thinking, business questions, spreadsheets, SQL, and visualization.
A Business Intelligence Analyst develops dashboards and reporting systems that help organizations monitor performance. Knowledge of SQL, Power BI, Tableau, and business metrics is valuable.
A Data Scientist works with statistics, programming, experimentation, and machine learning to solve complex analytical problems. The role often involves building predictive models and extracting insights from large datasets.
A Machine Learning Engineer focuses on developing, deploying, and maintaining machine learning systems. This role generally requires stronger software engineering and model deployment skills.
A Data Engineer develops the infrastructure and pipelines needed to collect, transform, store, and deliver data for analytical applications. SQL, Python, databases, distributed processing, and cloud technologies are commonly relevant.
A Data Visualization Specialist focuses on presenting information clearly through dashboards, reports, and visual storytelling.
These roles are not completely separate. Professionals may perform overlapping responsibilities, particularly in startups and smaller organizations.
11. How to Start Learning Data Science: A Practical Roadmap for Beginners
Starting a Data Science journey can feel overwhelming because the field includes programming, mathematics, statistics, databases, visualization, and machine learning. The best approach is to develop skills in a structured sequence instead of trying to learn everything simultaneously.
Stage 1: Understand Basic Data Concepts
Begin by understanding what data is, how it is collected, how it is organized, and why organizations analyze it.
Learn the differences between structured, unstructured, and semi-structured data. Understand variables, records, datasets, and basic analytical questions.
Practice reading simple tables and identifying patterns without immediately relying on advanced tools.
Stage 2: Learn Excel and Basic Data Analysis
Excel provides a practical starting point for understanding data manipulation.
Learn formulas, sorting, filtering, conditional formatting, pivot tables, charts, and basic lookup functions.
Work with a sample sales dataset and answer questions such as which product generates the highest revenue, which month performs best, and which region has the lowest sales.
This stage develops analytical thinking and helps beginners understand the purpose of data analysis.
Stage 3: Learn Statistics and Probability
Develop an understanding of mean, median, mode, standard deviation, distributions, correlation, probability, sampling, and hypothesis testing.
You do not need to master advanced mathematics immediately. Focus on understanding what each concept means, why it matters, and when it should be used.
Practice interpreting numerical results rather than memorizing formulas without context.
Stage 4: Learn SQL
Once you understand basic datasets, begin learning SQL.
Start with SELECT, WHERE, ORDER BY, GROUP BY, and aggregate functions. Then move to joins, subqueries, common table expressions, and window functions.
Practice using customer, employee, inventory, and sales databases.
SQL will help you retrieve the information needed for analytical projects.
Stage 5: Learn Python for Data Science
Learn Python fundamentals, including variables, data types, conditions, loops, functions, lists, dictionaries, and file handling.
Then explore NumPy and Pandas for numerical computing and data manipulation.
Practice loading datasets, identifying missing values, removing duplicates, grouping records, calculating summary statistics, and creating new variables.
Stage 6: Learn Data Visualization
Develop the ability to communicate insights through charts and dashboards.
Start with Matplotlib and Seaborn, then explore Power BI or Tableau.
Understand when to use bar charts, line charts, scatter plots, histograms, and other visual formats.
A good visualization should answer a specific question and make the important information easy to understand.
Stage 7: Explore Machine Learning
After developing a foundation in statistics, Python, and data preparation, begin learning machine learning.
Understand supervised learning, unsupervised learning, classification, regression, clustering, and model evaluation.
Start with simple projects such as predicting house prices, classifying customer churn, or grouping customers based on purchasing behaviour.
Focus on understanding the problem and evaluating the model rather than simply running algorithms.
Stage 8: Build Practical Projects
Practical projects are essential for developing confidence and demonstrating skills.
Create projects using publicly available datasets. Document the problem, data sources, preparation steps, analysis methods, findings, and limitations.
Publish your work in a professional portfolio. Include readable explanations, visualizations, and code where appropriate.
A portfolio that demonstrates how you approach real problems can be more meaningful than a long list of tools you have studied.
12. Practical Data Science Projects for Beginners
One of the most effective ways to learn Data Science is to work on small projects that solve understandable problems.
A sales performance analysis project can help beginners practice Excel, SQL, Python, and visualization. Use transaction records to examine monthly revenue, product performance, customer segments, and regional differences.
A customer churn analysis project can introduce the concepts of classification and predictive modelling. Examine customer information to identify characteristics associated with customers discontinuing a service.
A student performance analysis project can explore relationships between attendance, study time, assessment results, and academic progress. The objective should be to identify patterns that could help improve learning support, not to make unsupported judgments about individual students.
A personal expense analysis project can help learners understand data cleaning, categorization, summary statistics, and dashboard development. Use sample or appropriately protected financial records to examine spending patterns and monthly changes.
A weather data analysis project can introduce time-series data, visualization, and descriptive statistics. Learners can investigate temperature patterns, rainfall variation, and seasonal trends.
For every project, explain the question being investigated, the information used, the methods applied, the findings, and the limitations. This makes the project a demonstration of problem-solving rather than merely a collection of charts.
13. The Future of Data Science in an AI-Driven World
Data Science continues to evolve as artificial intelligence, cloud computing, automation, and connected devices create new ways to collect and process information.
Generative AI is changing how professionals interact with data. AI tools can assist with writing SQL queries, explaining code, summarizing reports, generating visualizations, and exploring datasets.
However, these tools do not remove the need for analytical judgment. Professionals must still verify results, identify incorrect assumptions, understand data quality, and evaluate whether an output makes sense in the real-world context.
Machine learning and deep learning are also expanding into areas such as language processing, computer vision, recommendation systems, and intelligent automation.
Cloud platforms make it possible for organizations to store and process large datasets without maintaining all infrastructure locally. Data engineering practices are becoming increasingly important as companies build reliable pipelines and analytical systems.
Another growing area is responsible AI and data governance. Organizations must consider privacy, fairness, transparency, security, and accountability when developing data-driven systems.
The future of Data Science will not belong only to people who can write complex code. It will also require professionals who understand business problems, ask meaningful questions, communicate findings, and use technology responsibly.
14. Final Thoughts: Turning Data into Knowledge and Knowledge into Action
Data Science is much more than programming, statistics, or machine learning. It is a systematic way of understanding the world through information. It helps individuals and organizations move beyond assumptions, investigate complex problems, discover patterns, and make decisions supported by evidence.
For beginners, the journey should start with curiosity and a willingness to experiment. Learning Excel, statistics, SQL, Python, and data visualization creates a strong foundation. Practical projects then help transform theoretical knowledge into real capabilities.
For working professionals, developing analytical skills can improve decision-making and open opportunities across different industries. For businesses, adopting data-driven practices can lead to better customer understanding, more efficient operations, and stronger strategic planning.
As technology continues to develop, data will remain an important part of innovation and organizational growth. Understanding how to collect, analyze, interpret, and communicate information will therefore be a valuable skill in the years ahead.
The most important lesson is simple: data becomes valuable when it helps answer meaningful questions and supports better actions. Learning Data Science is ultimately about developing the ability to turn information into understanding and understanding into practical results.
#DataScience #DataAnalytics #DataAnalysis #LearnDataScience #DataVisualization